

Google's Generative AI report is useful for measuring eligible-site impressions in AI Overviews and AI Mode by page, country, device and date. It is not a full attribution report: it does not reveal the queries that generated an answer, clicks, conversions, cited passages or answer position. Treat it as an exposure layer, then compare page cohorts with ordinary Search Console and analytics data without pretending there is a query-level join key.
That distinction matters because a new metric can invite a much larger story than the evidence supports. A report that says a page was displayed in a generative search surface can establish exposure. It cannot, by itself, establish why the page appeared, what text earned the appearance, whether a user visited, or whether a visit created revenue. Good reporting begins by preserving the denominator and the missing fields.
Update, September 26, 2026: the rollout is complete. On August 31, 2026, Google added a note to its announcement saying it had "rolled out these insights to all websites worldwide" (Google Search Central). The limits described below are unchanged: impressions only, with no queries and no clicks.
What Google has made measurable
Google documents the report as performance reporting for AI Overviews and AI Mode. Its available views use page, country, device and date, which makes the report valuable for observing how eligible pages are exposed over time and across segments. It is a page and surface dataset, not a record of every generated response.
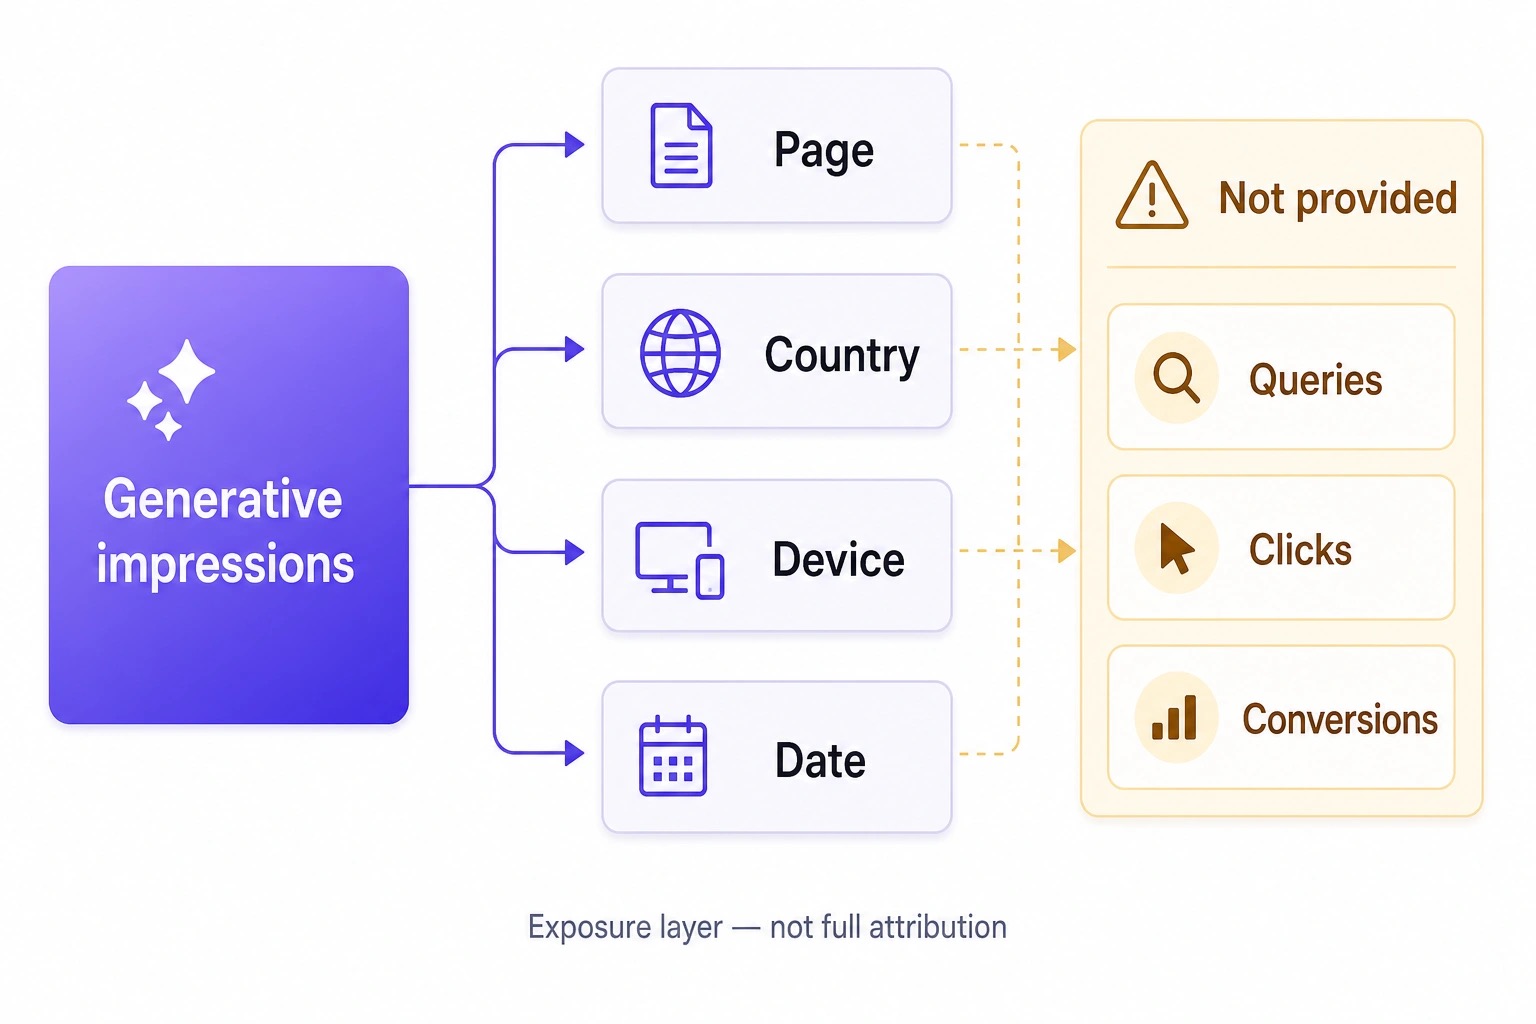
The following map separates the observed fields from the questions that still need another source of evidence.
| Measurement question | What the report provides | What remains unknown | Safe use |
|---|---|---|---|
| Which pages appeared? | Page-level impressions | The exact answer text and cited passage | Monitor canonical landing-page exposure. |
| Where did exposure occur? | Country and device views | A query-by-query audience path | Compare like-for-like segments. |
| When did it change? | Date view | A causal explanation for the change | Build a dated time series and annotate events. |
| Did it produce visits or value? | No reported clicks or conversions in this report | Traffic, leads, sales and assisted outcomes | Use separate ordinary Search Console and analytics views. |
| Which query produced an answer? | No generating-query dimension | Query intent, wording and answer position | Do not backfill a query story from a page total. |
Google also applies property, page aggregation and canonicalization rules. Search Labs activity is excluded. These qualifications are not footnotes to discard during export: they define the population being measured. If a team compares a domain property with a URL-prefix property, or mixes canonical and non-canonical URL views, it can manufacture movement that is only a scope mismatch.
The documented operational limits deserve the same care. Google describes UI and export constraints, including a 1,000-row limit. A result set is therefore an extract with a boundary, not proof that every possible matching row was inspected. Record the date window, filters, property type, interface surface and extraction time next to each snapshot. That small ledger is often the difference between a repeatable analysis and a confident but unrepeatable slide.
Read an impression as exposure, not attribution
An impression is useful evidence, but it has a narrower meaning than many reporting dashboards imply. It can show that an eligible page was exposed in an AI Overview or AI Mode. It does not show a visit, a citation's prominence, an answer position, or the wording that caused the answer to be generated. It also does not settle whether the same person would otherwise have clicked an ordinary result.
This prevents two common errors. The first is calling higher generative impressions a traffic gain before examining ordinary Search Console clicks and the relevant analytics landing-page view. The second is calling a lower number a content failure when the change might come from reporting scope, canonicalization, country mix, device mix, interface availability or the underlying AI-search surface. Both narratives turn an observation into causal attribution too early.
The practical question is therefore not, "Did AI search work?" It is, "For which stable page cohort did measured exposure change, under which report definition, and what other signals moved at the same time?" This is less dramatic, but it is a question the available evidence can support.
A worked cohort calculation
Use cohorts before interpreting a total. Group canonical pages by a durable editorial purpose, such as commercial pages, editorial guides, documentation and brand pages. Keep the grouping stable across periods. A URL can move between cohorts only with a logged reason, otherwise an organisational change can look like a search trend.
Here is an illustrative calculation, not a claim about Google performance. Suppose an editorial-guide cohort has 120 reported generative impressions in a baseline window and 180 in an equally long follow-up window. The exposure change is:
(180 - 120) / 120 × 100 = 50%
That 50% is a change in reported exposure for that cohort under the same filters. It is not a 50% increase in clicks, conversions, citations, rankings or revenue. To make the observation useful, create a companion record for the same canonical pages and dates:
| Companion measure | Compare it with | What it can clarify | What it cannot prove |
|---|---|---|---|
| Ordinary Search Console clicks | The cohort's exposure movement | Whether classic search traffic moved in the same window | That generative exposure caused the traffic change. |
| Analytics landing-page sessions | The same canonical URL set | Whether visits changed after filtering and tracking checks | The generative source of an individual session. |
| Conversion events | The same pages and window | Whether downstream actions changed | A conversion attributable to an AI Overview or AI Mode impression. |
| Publishing and migration log | The date series | Whether a page release, redirect or template event coincides | Causality without a suitable test. |
Avoid dividing clicks by generative impressions to create an apparent click-through rate. The report does not supply a click numerator that matches that denominator. A ratio can look mathematically tidy while joining two differently defined datasets. It is better to report parallel measures plainly than to produce a synthetic KPI with no documented interpretation.
A decision framework for the next action
The report is most useful when it changes the standard of evidence for an action, rather than triggering a batch of speculative pages. Use the pattern below to decide what deserves investigation.
| Observed pattern | First check | Appropriate action | Do not conclude |
|---|---|---|---|
| Exposure rises; ordinary clicks are stable | Scope, dates, country and device mix | Keep monitoring; review the relevant page cohort | AI exposure created additional traffic. |
| Exposure rises; ordinary clicks fall | Seasonality, ranking changes, releases and analytics tracking | Investigate the full search and landing-page picture | AI Overviews cannibalised clicks. |
| Exposure falls after a migration | Canonicals, redirects, property selection and date completeness | Repair measurement or migration issues if confirmed | The content became less useful to AI systems. |
| A single page spikes | Canonical URL, outliers, country/device split and publication log | Inspect the page and preserve the evidence snapshot | A specific query or passage caused the spike. |
| No report data is visible | Eligible-site status, rollout availability and filters | Record the absence and recheck the documented scope | The site has no generative visibility. |
The one action to take first is to establish a baseline export and a canonical-page cohort ledger. Content changes can wait. Without a comparable baseline, the next movement has no stable reference and any optimisation story is mostly hindsight.
A reusable capture protocol
Before analysis, save the following for every snapshot:
- Property type and exact property selected.
- Report surface, export time and date range.
- Applied country, device, page and other filters.
- Row count, the documented export boundary and whether the result may be truncated.
- Canonical URL set and cohort assignment.
- Releases, redirects, migrations, tracking changes and known data anomalies in the same period.
- The official source URL and the date on which the report definition was checked.
This protocol is deliberately modest. It does not promise access to hidden queries or conversion attribution. It creates an audit trail so a later analyst can see whether a difference is a page signal, a filter change, a property mismatch or a reporting change. Google’s own data anomalies guidance is useful context when a time series looks implausible.
Run a failure test before reporting a finding
For any notable change, try to disprove the attractive explanation. Re-export the same period with the original filters, then confirm the property type, country, device, canonical-page set and row boundary. Compare an untouched cohort with the cohort under discussion. Check the publishing and migration log. Finally, look for an official announcement or documented anomaly before treating an interface change as a performance event.
If the finding disappears when a filter or canonical rule is corrected, report the correction rather than the original narrative. If it persists, call it a measured association, not proof of cause. That language protects the reader and keeps future comparisons honest when Google changes coverage or definitions.
Where SEOryon fits
For the Search Console generative AI report, SEOryon is most useful after the evidence is scoped. It can turn a monitored change into a canonical decision, check whether an existing page already owns the need, route an approved action into production and keep the later result attached to the same URL, the kind of workflow covered in a buyer's guide to AI visibility tools that turn citation gaps into page-level fixes. A news headline alone should not trigger speculative page creation at scale.
That is an operational role: research, canonical decision, controlled content action, publishing and later measurement. This article does not extend that verified scope into undocumented product features or performance outcomes. Evaluate SEOryon on your own site with one controlled topic cluster before expanding automation.
Frequently asked questions
Can I identify the queries that generated an AI Overview from this report?
No. The documented views provide page, country, device and date, not the query that generated an answer. Use ordinary Search Console query data for its own defined reports, but do not present it as a query-level match to Generative AI report impressions.
Can I calculate AI-search click-through rate from the Generative AI report?
No defensible report-level rate can be calculated from this dataset alone because it does not provide matching clicks. Pair exposure with ordinary Search Console and analytics measures as separate signals, and state their different definitions.
What should I preserve before the interface or coverage changes?
Save the export, property type, filters, date range, row count, canonical-page cohort and observation date. Also preserve relevant releases, migrations and Google data-anomaly notes. These details make a later change interpretable.
Sources and evidence notes
- Google Search Console Help: Generative AI report
- Google Search Central: Generative AI performance reporting
- Google Search Console: data anomalies
Official documentation supports the report and product definitions. Interface availability was a subset rollout until Google completed it worldwide on August 31, 2026, the same live-feature-versus-rollout-versus-Labs distinction traced in an evidence-led briefing on Google I/O 2026's AI Search announcements for publishers. Recheck dated interface, coverage and export details before publication.


