

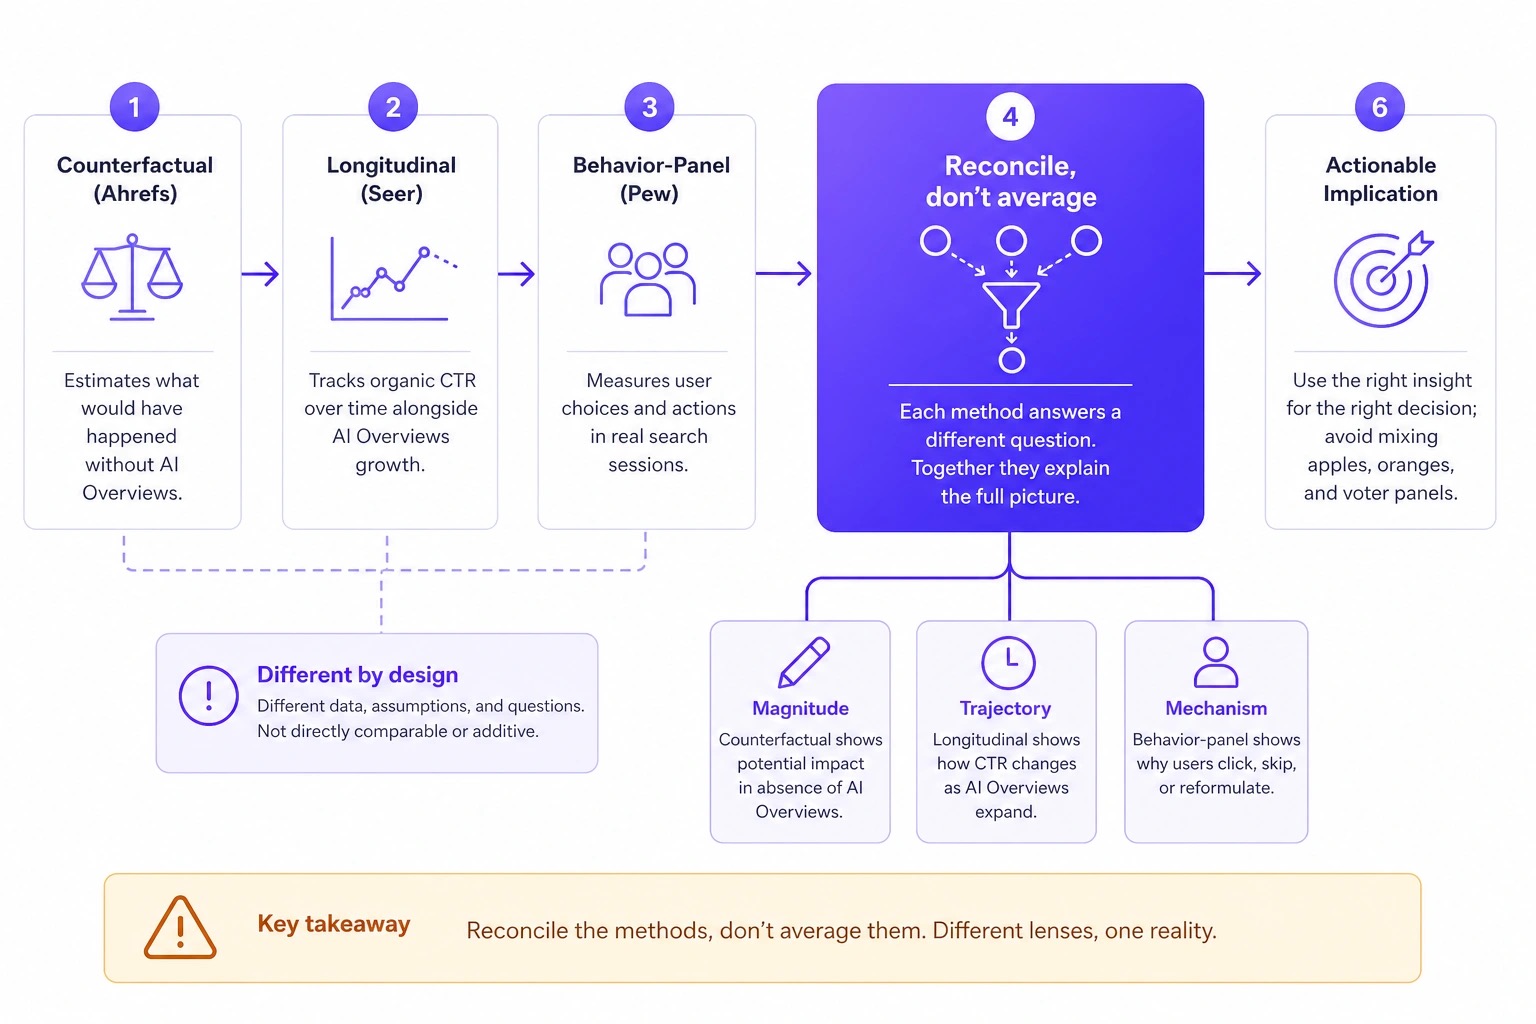
The available AI Overviews CTR evidence points in the same broad direction: AI summaries can reduce traditional-result clicking. It does not support one universal percentage. Ahrefs estimates a modeled counterfactual for ranked results, Seer tracks brand query cohorts over time, and Pew observes browsing behavior in a U.S. panel. Read each result within its denominator and method, then measure a matched cohort on your own site rather than averaging their headline figures.
The distinction is practical. A number may be accurate within a study and still be the wrong number for a forecasting model, a board slide, or a content decision. The common mistake is to turn three related observations into one precise answer by averaging them. That produces a figure with no study design behind it.
What the three studies can actually tell you
The studies ask overlapping but distinct questions. Start with the unit being compared, not the percentage in the headline.
| Evidence source | What it measured | Reported observation | Safe reading | Important limit |
|---|---|---|---|---|
| Ahrefs | A 300,000-keyword observational model for position-one results | 1.6% CTR in the AI Overview cohort versus 3.7% modeled without an AI Overview, described as 58% lower | A modeled difference between cohorts at rank one | Not a randomized intervention |
| Seer | Longitudinal data for 53 brands and millions of queries | A steep early CTR gap followed by partial recovery; cited brands differed from uncited brands | A time-series view of changing brand query cohorts | SERPs and query mix changed during observation |
| Pew Research Center | Recreated Google visits in a U.S. browsing panel | Traditional results were clicked in 8% of visits with a summary versus 15% without; summary citations were clicked in 1% | Observed user behavior when a summary was present | Not rank-normalized CTR |
All three rows are useful precisely because they are not interchangeable. Ahrefs is closest to a rank-specific counterfactual question: what is the estimated position-one CTR difference between an AI Overview cohort and a modeled no-AI-Overview comparison? Seer is useful for asking how a client-brand population changed over time, including a difference between cited and uncited brands. Pew is useful for asking what people did during observed visits where a summary was present or absent.
None of those designs says that every first-ranked page, brand, country, device, or query intent will experience the same change. AI Overview presence is not random. Neither are the pages, queries, and users that appear in each dataset. That is a reason to preserve the qualification, not a reason to ignore the studies.
Ahrefs: a modeled rank-one comparison
Ahrefs examined a 300,000-keyword observational model and estimated a position-one CTR of 1.6% for the AI Overview cohort versus 3.7% modeled without an AI Overview. It described the result as 58% lower. The important noun here is modeled. The comparison is not a before-and-after experiment in which identical search results were randomly assigned an AI Overview.
That does not make the estimate unhelpful. It gives a disciplined answer to a narrow question about rank-one cohorts. It becomes misleading only when the scope is silently widened to every organic position or every site.
A simple illustration shows why the numerator and denominator matter. If a position-one query cohort generated 10,000 impressions under the study's conditions, a 3.7% CTR corresponds to 370 clicks and a 1.6% CTR corresponds to 160 clicks. The difference is 210 clicks per 10,000 impressions. This is an illustration using the published rates, not a claim about any site's traffic. It also does not prove that the 210 clicks were caused solely by the summary: the cohorts were observational and modeled.
Use the Ahrefs figure when discussing a rank-one modeled cohort. Do not use it as a blanket traffic haircut for a whole domain. A domain-wide average blends positions, countries, devices, intents, brands, SERP features, and changes in demand. That is a different quantity.
Seer: a longitudinal brand-cohort signal
Seer reported longitudinal data across 53 brands and millions of queries. Its finding was not a flat, permanent CTR loss: it found a steep early gap and later partial recovery. It also reported different performance for cited and uncited brands.
This design contributes something the Ahrefs comparison cannot. A time series can show that the relationship is not necessarily static. It can reveal that the period of observation, the evolving interface, and membership in the cited group matter. It cannot by itself isolate a single cause, because the underlying SERPs and query mix changed while data was collected.
The cited-versus-uncited distinction deserves care. It is an observed difference in that longitudinal dataset, not proof that gaining a citation will cause the same CTR outcome for another site. A citation can be an important exposure event without becoming a visit. Pew's 1% observation for clicks on summary citations is a useful reminder that citation acquisition and click acquisition are separate measurements.
For reporting, retain Seer's time dimension. A line chart with an early gap and later partial recovery should not be compressed into one timeless percentage. If the business question is whether your pages have changed across several releases or interface changes, a documented time series and stable query cohorts are more relevant than a one-number benchmark.
Pew: observed behavior, not rank-normalized CTR
Pew Research Center observed U.S. browsing-panel behavior in recreated Google visits. It reported that users clicked a traditional search result in 8% of visits with an AI summary and 15% of visits without one. Users clicked a link in the summary itself in 1% of visits.
This evidence speaks in visits, not in rank-one impressions or a rank-normalized organic CTR model. It is especially useful for keeping a familiar but weak story in check: a cited link is not automatically a replacement click path. The 1% figure is an observation about summary-link clicking in this panel, not a prediction for every citation, search, or publisher.
Nor can the 8% and 15% figures be converted into an organic position-one loss estimate. The presence or absence of a summary is only one part of the visit context. Result position, query formulation, user need, device, and interface all matter. A percentage without its unit looks portable; it usually is not.
A decision framework for using the evidence
Choose the study based on the decision, then state what remains unknown.
| If you need to decide... | Most relevant evidence | What to record beside it | What not to claim |
|---|---|---|---|
| Whether rank-one opportunity may differ when an AI Overview appears | Ahrefs | Rank band, modeled cohort, 1.6% and 3.7% rates, 300,000-keyword sample | A causal loss for all rankings |
| Whether a brand cohort changed across time | Seer | Observation window, cited status, stable query definition, releases and SERP changes | That a citation alone caused recovery or decline |
| Whether summaries may change click behavior in observed visits | Pew | U.S. panel, visit-level unit, 8%, 15%, and 1% figures | Your own rank-specific CTR forecast |
| Whether to alter a page on your site | Your matched cohort | Page, query, rank, device, country, AI Overview exposure, date, clicks and impressions | That an external average proves the action |
The first action is not a batch rewrite. It is a baseline. Before changing content, capture a comparable period and identify the pages and query classes you will later compare. A content change that happens before the baseline can leave a team with an interesting story but no test.
Build a matched cohort instead of importing a universal haircut
Create cohorts that are stable enough to survive a monthly review. Each row should include the canonical URL, primary query or query class, rank band, country, device, date window, and whether an AI Overview was observed. Where an observation is not available, mark it as unknown rather than inferring it from a traffic change.
Then report both rates and counts. Click-through rate is:
CTR = clicks / impressions × 100
Suppose a matched cohort receives 4,000 impressions and 120 clicks in one window. Its CTR is 3%. In the next equally defined window it receives 5,000 impressions and 125 clicks. Its CTR is 2.5%, while absolute clicks rose by five. Neither observation alone settles whether the change is harmful. Demand, rank distribution, query mix, country, device, and interface exposure may all have moved. The useful record is the combination, annotated with what changed.
Use a small evidence ledger for every comparison:
- Save the source URL, date checked, observation window, sample, and unit for external evidence.
- Save canonical URLs and a durable query-class definition for the site cohort.
- Split, at minimum, by rank band, country, and device before treating a total as a trend.
- Keep impressions, clicks, CTR, and absolute clicks together.
- Log releases, redirects, tracking changes, and major query-mix shifts in the same period.
- Keep citation status separate from click data. A citation is not automatically a visit.
This is deliberately narrower than a promise of attribution. It provides a repeatable basis for deciding whether a content change deserves testing, while the evidence still contains uncertainty.
Run a failure test before publishing a conclusion
Try to disprove the finding before presenting it. If your AI Overview-exposed cohort has lower CTR, first check whether its average position changed. Then check whether the query class expanded toward informational searches, whether mobile share moved, whether the country mix shifted, and whether dates cover the same length and demand pattern. A mismatch on any one of these can create an apparent CTR effect.
Next, compare a holdout cohort with similar rank, intent, country, and device characteristics but no observed AI Overview exposure. This is still observational evidence, not a randomized test. Its value is diagnostic: if both cohorts moved similarly, the AI Overview explanation is weaker. If only the exposed cohort moved, the observation is more specific but still needs the other checks.
Do not manufacture certainty by removing inconvenient rows. Keep unknown exposure, incomplete observation, and methodology changes visible in the analysis. The correct output may be "monitor" rather than "rewrite." That is a useful decision when the evidence cannot yet separate demand, ranking, and interface effects.
Where SEOryon fits
SEOryon can carry the evidence behind AI Overviews CTR studies from monitoring into a controlled content decision. Its role here is operational: research, canonical decision, controlled content action, publishing, and later measurement. It should expose the existing owner, prevent a collision, publish only what was approved, and preserve the measurement trail. It does not make an uncertain observational study conclusive.
Evaluate SEOryon on your own site with one controlled topic cluster before expanding automation. The appropriate test is a scoped workflow with a documented baseline, not a promise that one external CTR study will predict your outcome.
Frequently asked questions
Can I average the Ahrefs, Seer, and Pew percentages?
No. They use different units and methods: an observational model for position-one results, longitudinal brand-client cohorts, and observed U.S. browsing visits. An arithmetic average would not describe a population or a defensible expected CTR.
Does appearing as an AI Overview citation guarantee a click?
No. Seer found cited and uncited brands performed differently in its dataset, while Pew observed clicks on summary citations in 1% of visits with a summary. Those observations make citation status worth measuring, but they do not turn a citation into a guaranteed visit or ranking effect, especially since only a minority of AI Overview citations rank in Google's top 10 results.
What should a publisher measure first?
Start with a dated matched cohort: canonical URLs, query class, rank band, country, device, impressions, clicks, CTR, and observed AI Overview exposure. Keep content releases and measurement changes in the same log. That preserves the context needed to interpret a later movement.
Sources and evidence notes
- Ahrefs: AI Overview citations and Google top-10 overlap
- Seer Interactive: AIO impact on Google CTR, 2026 update
- Pew Research Center: browsing behavior around AI summaries
The cited evidence is observational and has different samples, units, and time windows. Treat each percentage as a scoped finding, not as a universal causal effect.


